
Dashboards Should Drive Decisions
From Reporting to Decisioning: Make PMM’s Value Undeniable
Systems, Not Slides — Chapter 8: Metrics, Dashboards & ROI
“What you can’t measure, you can’t defend. What you can’t explain, you can’t scale.”
Every PMM has lived this moment.
The strategy worked. The story shifted the room. Sales started using your lines. Then the board meeting comes, and someone asks:
“So… what did product marketing do?”
You show campaign numbers. They nod. They ask about revenue. You talk about “influence.” They smile politely.
You walk out knowing the truth: the impact is real, the evidence is thin.
That gap is what Chapter 8 is built to close.
The Problem Isn’t Measurement. It’s What We Measure.
Most PMM dashboards are optimized for reporting. Strong PMM systems are optimized for decisioning. That distinction sounds subtle, but it’s the entire shift.
Dashboards brim with CTR and impressions. They’re useful signals of fit, but they’re not proof of value. Quarterly roll-ups arrive after the decisions that mattered. Exec reports read like museum tours — “on this chart, you’ll see…” — instead of a call sheet that says “here’s what to stop, start, and scale this week.”
Reporting is backward-looking. Decisioning is forward-moving.
One survives the meeting. The other shapes what happens after it.
The PMM Impact Chain
Product marketing has always been judged in two currencies: influence and impact. Influence is easy to feel and hard to prove. Impact is the part the business funds. Most PMM teams get stuck translating the first into the second. They show activity on one end — assets shipped, launches executed — and lagging outcomes on the other — pipeline influenced. The middle, the mechanism that turns story into revenue, goes missing. When that mechanism is invisible, PMM looks like a cost, not a compounding asset.
The chain is simple to say and powerful to operationalize:
Narrative Fit → Engagement Quality → Sales Momentum → Revenue Outcomes
Fit tells you the idea resonated — buyers paid attention. Quality tells you the right buyers leaned in, which is a different conversation than clicks. Momentum shows deals moving cleaner and faster — objections resolved, security reviews shortened, proposals reached sooner. Outcomes confirm it paid in the currencies leadership respects: win rate, ASP, expansion, renewal.
PMM’s job is to intentionally move the first two links, and prove how those movements cascade into the last two. The rule that makes this real: every major initiative must name one metric in each link before work starts.
Tag the Story So Data Can Find It
If it isn’t tagged, it can’t be measured. That’s the unglamorous foundation that makes everything downstream possible.
Narrative tags belong on every surface — site block, ad, email, deck slide. Persona and stage tags belong on every variant. Each stat, quote, and logo gets a Proof ID, so you can see which proofs actually sell versus which ones just sit in the deck.
Sales intro variants get logged in CRM, with three options as the ceiling so the data stays clean. Keep the tags short, keep them consistent, and make them visible to analytics and RevOps so the whole company is reading from the same dictionary.
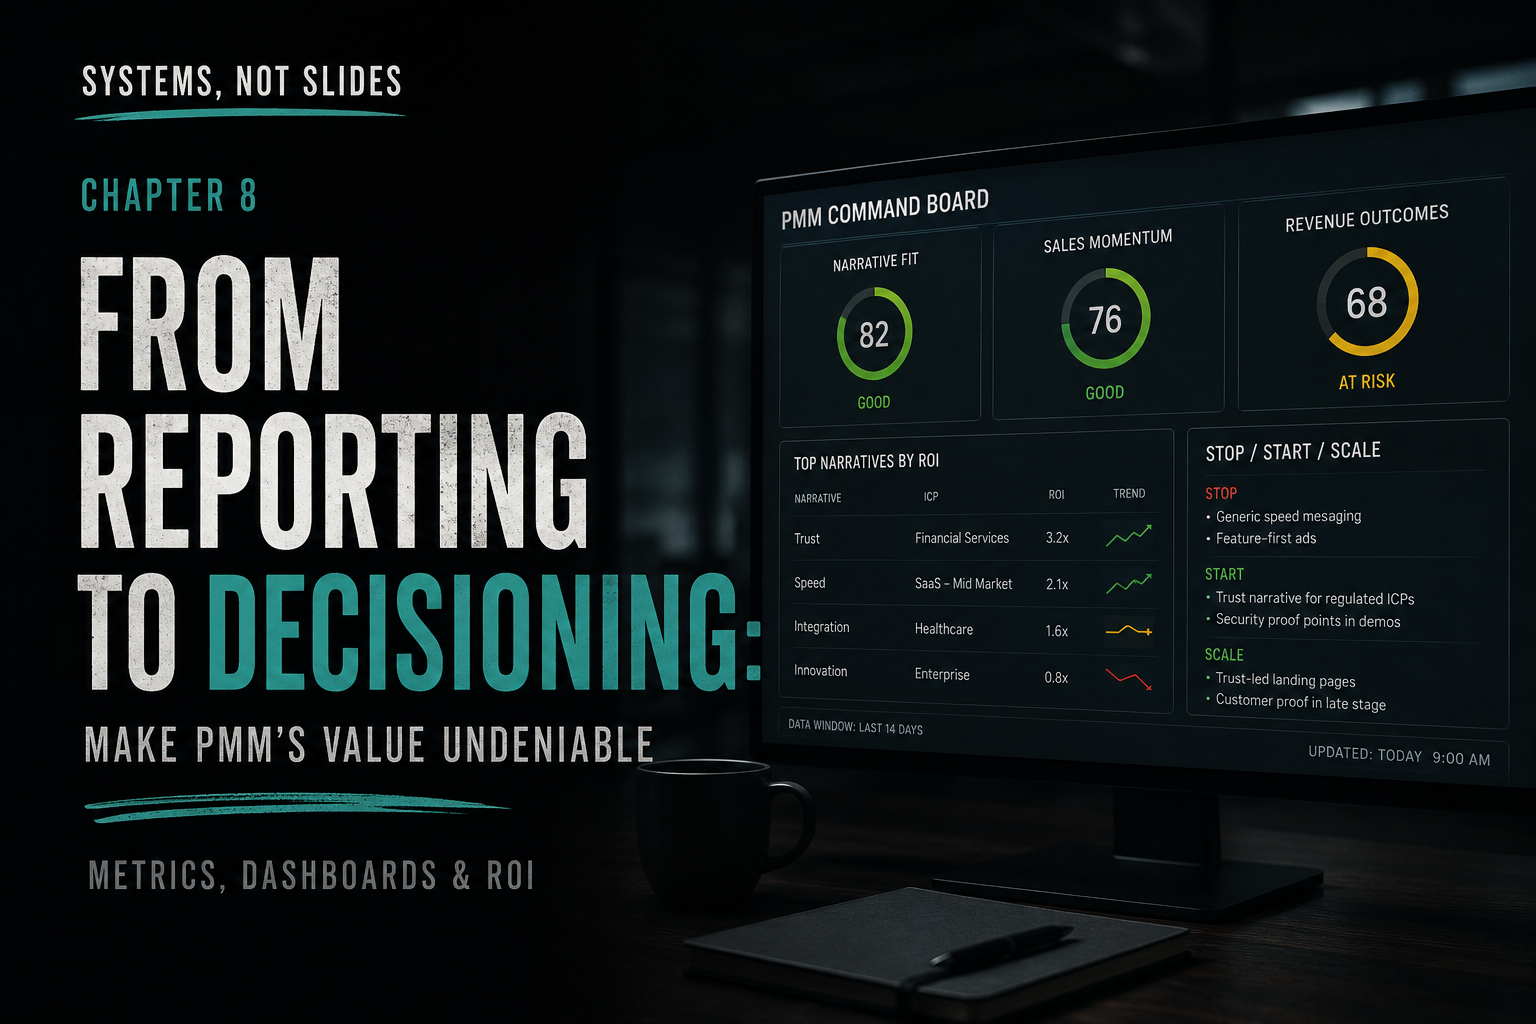
Build the Command Board: One Screen, Three Needles
If leadership sees everything, they change nothing. The Command Board exists to show only what moves decisions.
The top row carries three needles — Narrative Fit, Sales Momentum, Revenue Outcomes — each rendered as green, amber, or red. The middle of the board is a leaderboard of narratives and themes ranked by ROI and ICP, so the highest-leverage story is visible at a glance.
The bottom is the part that makes the whole thing a steering wheel: Stop / Start / Scale, three bullets, generated weekly, owned by name.
Then wire in a standing AI prompt to keep the board honest week to week:
“Using last 14 days of tagged data, summarize:
(1) which narrative is outperforming by ICP,
(2) where momentum stalls,
(3) the 3 most leveraged changes to make this week.
Keep to 10 bullets.”
That’s the difference between a dashboard and a steering wheel.
Stop / Start / Scale — The Weekly Ritual
Three bullets is harder than thirty. That’s the point.
Stop what’s elegant but inert. Start what early signals endorse. Scale what moves dollars, not clicks.
If the data can’t change Tuesday’s plan, it’s decoration.
What This Looks Like When It Works
After a tagging sprint, one team noticed something counterintuitive.
Their Trust narrative produced lower top-of-funnel clicks than Speed. On a vanity dashboard, Trust would have been killed inside thirty days. But in Financial Services, demo quality lifted +22%, security review cycles fell by 10 days, win rate rose +7 points, and ASP climbed +8%.
Without tags, that finding doesn’t exist.
With tags, the board approved shifting 40% of paid budget to trust-forward surfaces for regulated ICPs.
That’s the chain doing its work.
Narrative Fit explained the engagement story. Engagement Quality exposed the buyer story. Sales Momentum confirmed the deal story. Revenue Outcomes paid for the next bet.
PMM didn’t ask for budget.
PMM earned it.
The Traps to Avoid
Three failure modes show up in almost every measurement system.
The first is attribution hubris — crediting a single asset for a deal won by ten things. The second is dashboard sprawl — forty charts, zero decisions, a wall of color that nobody acts on. The third is analysis theater, where insights get presented in stylish slides but never change anyone’s behavior the following week.
The cure is discipline.
Tag the story. Define the four-link chain up front. Instrument the leading indicators you actually control. Commit to weekly Stop / Start / Scale.
And remember the line that earns executive trust faster than any dashboard ever will:
Executives don’t need certainty. They need direction they can act on.
The Human Edge
AI can surface that Trust copy yielded lower top-of-funnel clicks but higher demo quality among regulated buyers.
Only you can say:
“Shift spend to trust-forward surfaces for Financial Services. Retire Speed for that segment. Elevate the audit proof everywhere enterprise buyers look.”
That sentence is decisioning.
And because the chain is instrumented, you come back next month and prove the cycles shortened and the win rate rose. Then you ask for more budget with proof.
The Real Payoff
The real payoff isn’t a prettier dashboard. It’s compounding alignment. Marketing stops optimizing for cheap clicks and starts optimizing for qualified momentum. Sales stops guessing which intro to use and starts running the talk track the data endorsed. Leadership stops asking “What does PMM do?” and starts asking “What does the data say to do next?”
When measurement becomes decisioning, PMM graduates from storytelling to strategy with proof. That’s the kind of function companies fund, protect, and promote.
Stop counting what you shipped.
Start steering what ships next.
More measurement systems like this are explored inside Systems, Not Slides, where positioning, launches, enablement, and competitive intelligence are connected through shared feedback loops:
You may also like
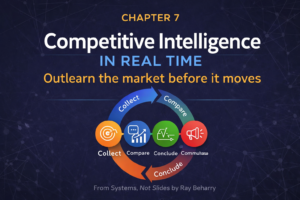
Designing Real-Time Intelligence for Sales

Launches that Learn